Flask on Heroku! Seems a complete gibberish if you encounter them for the first time. But to me, for what I intend, they are very precious tools for any web developer.
In a previous post I created a small function that allowed bringing data from World Bank’s World Development Indicators and producing nice charts. In this post, I will build upon that function but wrap it into a web application so that the world can benefit from.
Flask as a web framework
Flask is a cool web framework that is very popular for those who want to build things quickly and enjoy the flexibility. Their slogan is web development one drop at a time. It is based on python, so we do not require to re-write the things we did locally.
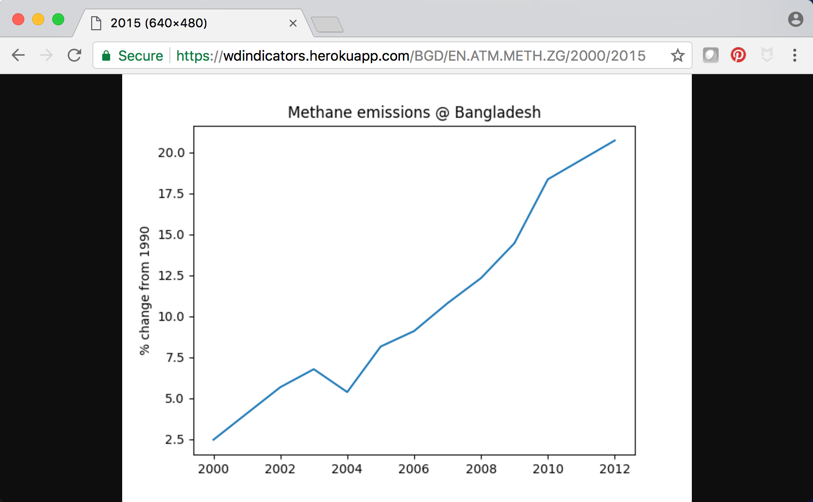
My idea is to create a web app that brings you a trend chart on indicators based on what you provide is the URL. So, for example the following URL will bring you chart for:
- the country Bangladesh (which has country code
BGD) - indicator “Methane Emissions (% change from 1990)” (which has indicator code of
EN.ATM.METH.ZG) - start date:
2000 - end date:
2015
http://www.example.com/BGD/EN.ATM.METH.ZG/2000/2015
The above link should bring me the following image
So, how to do it?
Here I do not intend to provide a tutorial on flask. For that you may visit the famous mega tutorial by Miguel, or set of nice youtube tutorial by Michael Herman.
Here is a rough sketch of the typical steps:
# created the intended directory
mkdir indicators
cd indicators

#create virtual environment named indicators and install flask
conda create -n indicators flask

#activate the environment
source activate indicators

# create the application program
touch app.py

# after you populate the app.py run the program and enjoy the output in browser

python app.py
Here is my app.py file.
1
2
3
4
5
6
7
8
9
10
11
12
13
14
15
16
17
18
19
20
21
22
23
24
25
26
27
28
29
30
31
32
33
34
35
36
37
38
39
40
41
42
43
44
45
46
47
48
49
from flask import Flask, render_template, make_response
import numpy as np
import pandas as pd
import wbdata as wb
import datetime
import re
from io import BytesIO
from matplotlib.backends.backend_agg import FigureCanvasAgg as FigureCanvas
from matplotlib.figure import Figure

app = Flask(__name__)

data_path = './static/'

@app.route('/<cc>/<indicator>/<int:start>/<int:end>')
def get_indicator(cc,indicator,start,end):
    # find the full name of a country from its code
    dat = pd.read_csv(data_path + 'country_codes.csv')
    country_string = dat.loc[dat['alpha-3']==cc, 'name'].to_string(index=False)
    ind = wb.get_indicator(indicator, display=False)
    # capture the title which includes the unit after bracket
    title = ind[0]['name']
    # now take entire text from first letter to before opening bracket
    title = title[:title.find('(')-1]
    title = title + ' @ '  + country_string
    # this is the pattern to match anything between two brackets
    p = re.compile('\((.*?)\)')
    ylab = p.findall(ind[0]['name'])[0]
    #matplotlib stuff
    fig = Figure()
    axis = fig.add_subplot(111, title=title, ylabel=ylab )
    data_dates = (datetime.datetime(start,1,1), datetime.datetime(end,1,1))
    #call the world bank api
    res = wb.get_dataframe({indicator:'value'},
            country=cc, data_date = data_dates, convert_date=False, keep_levels=False)
    #extract x and y axis data from the above dataframe as lists
    x = res.index.tolist()
    y = res['value'].tolist()
    axis.plot(x,y)
    #now place the plot inside canvas
    canvas = FigureCanvas(fig)
    output = BytesIO()
    canvas.print_png(output)
    response = make_response(output.getvalue())
    response.mimetype = 'image/png'
    return response

if __name__ == '__main__':
    app.run(debug=True)
Here are few points to note.
In line 15 we created the decorator that represents the URL structure as shown earlier containing the four information we need.
Note that I have a csv file under my /static/ folder containing country codes which I read at line 18 into a dataframe called dat. This file is used to provide a mapping between the 3-alpha code in the URL and the actual name of the country (line 19), which I used to incorporate in the title of my chart (line 25).
As I said, refer to my earlier post for matters related to matplotlib charting.
Lines 41 - 45 are technical stuff for rendering a png image into an html page. I got hints from a number of pages among them is this page.
Heroku is not nonsense
The founder of Heroku invented this Japanese theme name by merging heroic and haiku. This nonsensical meaningless word after all proved to be very useful for web developers.
There are many other ways to deploy your flask apps to the world. Amazon has a wide range of free tire offerings. I have wasted some time trying that with no success. The problem is always importing pandas package in the remote servers. Please let me know if you were successful to deploy a flask app that has pandas on AWS. I would love to know how to do that.
Somebody pointed out a nice trick as a workaround to similar problem in Heroku. Just have Heroku first install numpy and then pandas in two separate deployments.
Here are the steps for a typical Heroku setup:
heroku login
pip install gunicorn

#you can test the app locally
gunicorn -b 127.0.0.1:4000 app:app

#now create Procfile in root with this content
web: gunicorn app:app

#you can check things are OK
heroku local check

#now pip freeze
pip freeze > requirements.txt

#Now the typical gitting stuff

touch .gitignore #place the ignorable stuff there
git init
git add .
git commit -m 'first commit'

#Now create the app on remote heroku server
heroku create wdindicators
git push heroku master
heroku ps:scale web=1
heroku ps # to check it is working
heroku open # enjoy!
Now try my Heroku app with some samples below:
#Methane emission in USA
https://wdindicators.herokuapp.com/USA/EN.ATM.METH.ZG/1990/2015

#GDP in USA
https://wdindicators.herokuapp.com/USA/NY.GDP.MKTP.CD/2000/2010

#Mobile cellular subscription in Suriname
https://wdindicators.herokuapp.com/SUR/IT.CEL.SETS.P2/1990/2010