The purpose of this post is to give a hands-on demo on how to fetch data from World Bank’s famous World Development Indicators using a very handy wbdata package from python. Also, along this tutorial, you will get to know some regular expression usage in python, and how we can improve the matplotlib charting library with seaborn package.
First, let us install the library wbdata.
!pip install wbdata
Then import the library as usual.
import wbdata
Actually this package can connect to lots of data sources maintained by World Bank. We can view these data sources as follows.
wbdata.get_source()
11	Africa Development Indicators
36	Statistical Capacity Indicators
31	Country Policy and Institutional Assessment
41	Country Partnership Strategy for India (FY2013 - 17)
1 	Doing Business
30	Exporter Dynamics Database ��� Indicators at Country-Year Level
12	Education Statistics
13	Enterprise Surveys
28	Global Financial Inclusion
33	G20 Financial Inclusion Indicators
14	Gender Statistics
15	Global Economic Monitor
27	Global Economic Prospects
32	Global Financial Development
21	Global Economic Monitor Commodities
55	Commodity Prices- History and Projections
34	Global Partnership for Education
29	The Atlas of Social Protection: Indicators of Resilience and Equity
16	Health Nutrition and Population Statistics
39	Health Nutrition and Population Statistics by Wealth Quintile
40	Population estimates and projections
18	IDA Results Measurement System
45	Indonesia Database for Policy and Economic Research
6 	International Debt Statistics
54	Joint External Debt Hub
25	Jobs
37	LAC Equity Lab
19	Millennium Development Goals
24	Poverty and Equity
20	Quarterly Public Sector Debt
23	Quarterly External Debt Statistics GDDS
22	Quarterly External Debt Statistics SDDS
44	Readiness for Investment in Sustainable Energy
46	Sustainable Development Goals
35	Sustainable Energy for All
5 	Subnational Malnutrition Database
38	Subnational Poverty
50	Subnational Population
43	Wealth accounting
57	WDI Database Archives
2 	World Development Indicators
3 	Worldwide Governance Indicators
We are interested in source no. 2. This source contains thousands of indicators, so how can we search them by keyword. Here is the way.
wbdata.search_indicators('emission', source=2)
EN.CO2.TRAN.ZS      	CO2 emissions from transport (% of total fuel combustion)
EN.CO2.OTHX.ZS      	CO2 emissions from other sectors, excluding residential buildings and commercial and public services (% of total fuel combustion)
EN.CO2.MANF.ZS      	CO2 emissions from manufacturing industries and construction (% of total fuel combustion)
EN.CO2.ETOT.ZS      	CO2 emissions from electricity and heat production, total (% of total fuel combustion)
EN.CO2.BLDG.ZS      	CO2 emissions from residential buildings and commercial and public services (% of total fuel combustion)
EN.CLC.GHGR.MT.CE   	GHG net emissions/removals by LUCF (Mt of CO2 equivalent)
EN.ATM.SF6G.KT.CE   	SF6 gas emissions (thousand metric tons of CO2 equivalent)
EN.ATM.PFCG.KT.CE   	PFC gas emissions (thousand metric tons of CO2 equivalent)
EN.ATM.NOXE.ZG      	Nitrous oxide emissions (% change from 1990)
EN.ATM.NOXE.KT.CE   	Nitrous oxide emissions (thousand metric tons of CO2 equivalent)
EN.ATM.NOXE.EG.ZS   	Nitrous oxide emissions in energy sector (% of total)
EN.ATM.NOXE.EG.KT.CE	Nitrous oxide emissions in energy sector (thousand metric tons of CO2 equivalent)
EN.ATM.NOXE.AG.ZS   	Agricultural nitrous oxide emissions (% of total)
EN.ATM.NOXE.AG.KT.CE	Agricultural nitrous oxide emissions (thousand metric tons of CO2 equivalent)
EN.ATM.METH.ZG      	Methane emissions (% change from 1990)
EN.ATM.METH.KT.CE   	Methane emissions (kt of CO2 equivalent)
EN.ATM.METH.EG.ZS   	Energy related methane emissions (% of total)
EN.ATM.METH.EG.KT.CE	Methane emissions in energy sector (thousand metric tons of CO2 equivalent)
EN.ATM.METH.AG.ZS   	Agricultural methane emissions (% of total)
EN.ATM.METH.AG.KT.CE	Agricultural methane emissions (thousand metric tons of CO2 equivalent)
EN.ATM.HFCG.KT.CE   	HFC gas emissions (thousand metric tons of CO2 equivalent)
EN.ATM.GHGT.ZG      	Total greenhouse gas emissions (% change from 1990)
EN.ATM.GHGT.KT.CE   	Total greenhouse gas emissions (kt of CO2 equivalent)
EN.ATM.GHGO.ZG      	Other greenhouse gas emissions (% change from 1990)
EN.ATM.GHGO.KT.CE   	Other greenhouse gas emissions, HFC, PFC and SF6 (thousand metric tons of CO2 equivalent)
EN.ATM.CO2E.SF.ZS   	CO2 emissions from solid fuel consumption (% of total)
EN.ATM.CO2E.SF.KT   	CO2 emissions from solid fuel consumption (kt)
EN.ATM.CO2E.PP.GD.KD	CO2 emissions (kg per 2011 PPP $ of GDP)
EN.ATM.CO2E.PP.GD   	CO2 emissions (kg per PPP $ of GDP)
EN.ATM.CO2E.PC      	CO2 emissions (metric tons per capita)
EN.ATM.CO2E.LF.ZS   	CO2 emissions from liquid fuel consumption (% of total)
EN.ATM.CO2E.LF.KT   	CO2 emissions from liquid fuel consumption (kt)
EN.ATM.CO2E.KT      	CO2 emissions (kt)
EN.ATM.CO2E.KD.GD   	CO2 emissions (kg per 2010 US$ of GDP)
EN.ATM.CO2E.GF.ZS   	CO2 emissions from gaseous fuel consumption (% of total)
EN.ATM.CO2E.GF.KT   	CO2 emissions from gaseous fuel consumption (kt)
NY.ADJ.SVNX.GN.ZS   	Adjusted net savings, excluding particulate emission damage (% of GNI)
NY.ADJ.SVNX.CD      	Adjusted net savings, excluding particulate emission damage (current US$)
NY.ADJ.SVNG.GN.ZS   	Adjusted net savings, including particulate emission damage (% of GNI)
NY.ADJ.SVNG.CD      	Adjusted net savings, including particulate emission damage (current US$)
NY.ADJ.DPEM.GN.ZS   	Adjusted savings: particulate emission damage (% of GNI)
NY.ADJ.DPEM.CD      	Adjusted savings: particulate emission damage (current US$)
As you can see, the function returns a list of indicator names and their codes. Let us choose the indicator with title CO2 emissions (kg per 2011 PPP $ of GDP) and code EN.ATM.CO2E.PP.GD.KD
We can get details of a particular indicator by knowing its code number as follows.
ind = wbdata.get_indicator('EN.ATM.CO2E.PP.GD.KD', display=False)
When you specify display=False then you enable the output to be kept in a variable (in our case it is ind), which we can easily display as below.
ind
[{'id': 'EN.ATM.CO2E.PP.GD.KD',
  'name': 'CO2 emissions (kg per 2011 PPP $ of GDP)',
  'source': {'id': '2', 'value': 'World Development Indicators'},
  'sourceNote': 'Carbon dioxide emissions are those stemming from the burning of fossil fuels and the manufacture of cement. They include carbon dioxide produced during consumption of solid, liquid, and gas fuels and gas flaring.',
  'sourceOrganization': 'Carbon Dioxide Information Analysis Center, Environmental Sciences Division, Oak Ridge National Laboratory, Tennessee, United States.',
  'topics': [{'id': '19', 'value': 'Climate Change'},
   {'id': '6', 'value': 'Environment '}]}]
As you can see, this function returns the value as a dictionary, from which we can extract desired information. Let us say we want to know the name of the indicator.
ind[0]['name']
'CO2 emissions (kg per 2011 PPP $ of GDP)'
After we found the indicator, let us choose a number of countries to investigate. For that let us search for country codes.
wbdata.search_countries("Bangladesh")
BGD Bangladesh
wbdata.search_countries("Saudi")
SAU Saudi Arabia
We now have indicator code and country codes, all we need now is two dates to narrow our search. Let us say that we want to search the database from 2001 to 2015. Here is the way we keep the two dates.
import datetime
data_dates = (datetime.datetime(2001,1,1), datetime.datetime(2015,1,1))
By now we have all the ingredients, all we need now is to call the most important function: get_dataframe to fetch the data and keep it inside a dataframe.
import pandas as pd
data = wbdata.get_dataframe({'EN.ATM.CO2E.PP.GD.KD':'values'},
                            country=('BGD', 'SAU'),
                            data_date=data_dates,
                            convert_date=False, keep_levels=True)
data.head()
| values | ||
|---|---|---|
| country | date | |
| Bangladesh | 2015 | NaN |
| 2014 | NaN | |
| 2013 | 0.154309 | |
| 2012 | 0.160099 | |
| 2011 | 0.160661 |
It seems the dataframe is indexed twice: country-wise as well as date-wise. I am not very comfortable in dealing with multi-indexed dataframes, so I would feel better to reset_index so that I can apply filters more conveniently.
data = data.reset_index()
Now, let us see few lines of the dataframe after resetting index.
data.head()
| country | date | values | |
|---|---|---|---|
| 0 | Bangladesh | 2015 | NaN |
| 1 | Bangladesh | 2014 | NaN |
| 2 | Bangladesh | 2013 | 0.154309 |
| 3 | Bangladesh | 2012 | 0.160099 |
| 4 | Bangladesh | 2011 | 0.160661 |
After this proof of concept, let us wrap up these small bits and pieces into a function that will take a country, an indicator ID and start and end dates and return a list which can be used to plot charts later.
def country_data(country_code, indicator, start=2000, end=2015):
    import datetime
    import wbdata
    data_dates = (datetime.datetime(start,1,1), datetime.datetime(end,1,1))
    #call the api
    data = wbdata.get_dataframe({indicator:'indicator'},
                                country=country_code,
                                data_date=data_dates,
                                convert_date=True,
                                keep_levels=False)

    data = data.reset_index()
    #data = data.dropna() #if I want I can drop the na's
    return data[['indicator']]
And a small test to check things are running well.
country_data('IDN','EN.ATM.CO2E.PP.GD.KD')
| indicator | |
|---|---|
| 0 | NaN |
| 1 | NaN |
| 2 | 0.197236 |
| 3 | 0.260391 |
| 4 | 0.264045 |
| 5 | 0.209629 |
| 6 | 0.231842 |
| 7 | 0.226354 |
| 8 | 0.216339 |
| 9 | 0.211427 |
| 10 | 0.221036 |
| 11 | 0.230642 |
| 12 | 0.227291 |
| 13 | 0.230597 |
| 14 | 0.231680 |
| 15 | 0.214482 |
Now it is time to write a grand function that takes as input a list of country codes, then uses our function above country_data to get a list of indicators for each country, then plot a line diagram.
def plot_indicators(country_list, indicator, start=2000, end=2015):
    import matplotlib.pyplot as plt
    import seaborn as sns
    import wbdata
    import re
    ind = wbdata.get_indicator(indicator, display=False)
    # capture the title which includes the unit after bracket
    title = ind[0]['name']
    # now take entire text from first letter to before opening bracket
    title = title[:title.find('(')-1]
    # this is the patter to match anything between two brackets
    p = re.compile('\((.*?)\)')
    ylab = p.findall(ind[0]['name'])[0]
    sns.set_style('white')
    fig, axis = plt.subplots()
    for c in country_list:
        axis.plot(range(start,end+1),country_data(c,indicator,start,end))
    plt.legend(country_list)
    plt.title(title)
    plt.ylabel(ylab)
    plt.show()
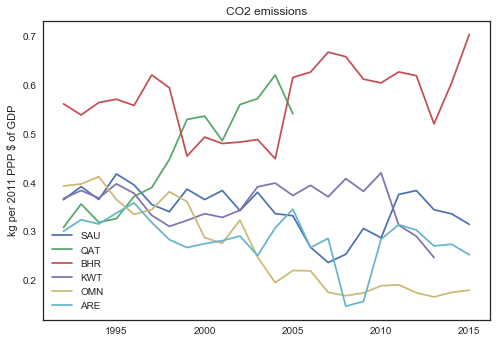
Let us test the function with gulf countries: Saudi Arabia, Qatar, Bahrain, Kuwait, Oman and U.A.E since 1990.
plot_indicators(['SAU', 'QAT', 'BHR', 'KWT', 'OMN', 'ARE'],
	'EN.ATM.CO2E.PP.GD.KD',1990,2015)
There are few points to illustrate in the function above.
First, note that -in order to render better chart- I have used seaborn data visualization package which basically sits on top of matplotlib. I just set_style our chart to one of seaborn’s styles for better output but the matplotlib commands remains the same.
Second, I had to extract from the title of the indicator the unit which sits in between parenthesis. To do that I used regular expression. So, let me explain this point further.
You saw above how I got the name of the indicator which returned something like GDP per unit of energy use (constant 2011 PPP $ per kg of oil equivalent)
Note that the name of all World Bank indicators starts with the actual title of the indicator, followed by the unit in between parenthesis. So, how we can extract these two parts.
Let us start with the first part which is easier. We want to start taking string subset from position 0 until we see the first opening bracket, that would be our title part. In order to do that, I used strings find() function as follows.
test_string = 'GDP per unit of energy use (constant 2011 PPP $ per kg of oil equivalent)'
test_string[:test_string.find('(')-1]
'GDP per unit of energy use'
find returns be the position of '(', so I take the string from position 0 to position of open bracket minus one (because the last character before bracket is a space which I want to ignore).
Now, the more difficult part is the unit which sits in between brackets. I could have used the same find() to search for index of closing bracket. But let me use regular expression so practice this powerful tool.
First we need to import regular expression package re. Then we need to design the pattern we are interested in which is anything in between open and close parenthesis. That is: '\((.*?)\)'. Check this stackoverflow post to get more information. I am using findall() function to return a list of all instances, and then I take the first instance of the list (at position 0).
import re
p = re.compile('\((.*?)\)')
p.findall('GDP per unit of energy use (constant 2011 PPP $ per kg of oil equivalent)')[0]
'constant 2011 PPP $ per kg of oil equivalent'
With these separation between title and unit, we can easily incorporate them in the ylabel and title of our matplotlib charts as done in our function above: plot_indicators.
With this, I hope you can carry-on on your own with much more interesting queries and experiments.