United Nation’s Statistical Division is the official sponsor of Sustainable Development Goals data. They have recently launched website hosting data. It allows retrieving information about indicators for a country, or retrieving all country data for an indicator. However, the site does not have yet visualization or interactivity facility. They just dump a huge table of data.
This post attempts to complete what this site missed: visualization of SDG indicator for a country. I will first retrieve country data using URL string. Then, after cleaning the data, I will write a function that takes as input a country and one of the 17 goals and returns trend charts of all indicators related to that goal.
Here is a glimpse of a typical input and output.
sdg_country_plot('Bangladesh',7)
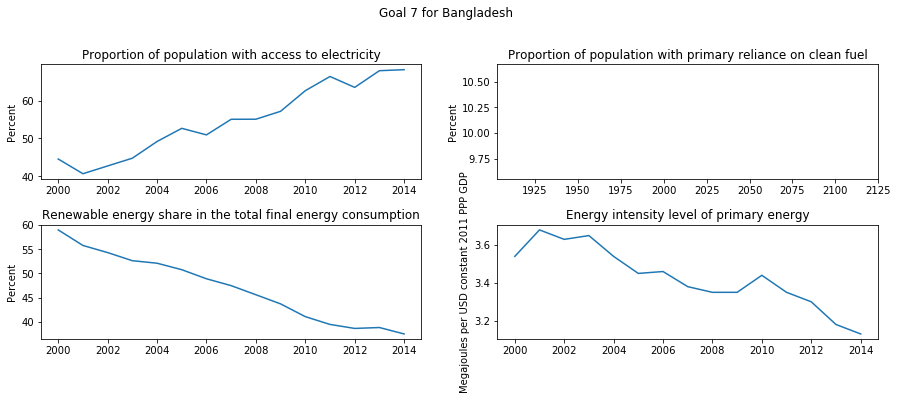
So, above are the available indicators for goal # 7 Ensure access to affordable, reliable, sustainable and modern energy for all for Bangladesh.
Let us roll our sleeves and get our hand’s dirty.
URL structure
The URL to fetch Bangladesh data is as follows:
https://unstats.un.org/sdgs/indicators/database/?area=BGD
All you need is to append the three alphabet country code (for example BGD for Bangladesh) at the end of https://unstats.un.org/sdgs/indicators/database/?area=
But, I do not memorize country codes, so, first let me create a handy function to fetch this 3-alpha country code given the name of a country.
Getting country codes
This site lists all such codes within a table in their page as follows.
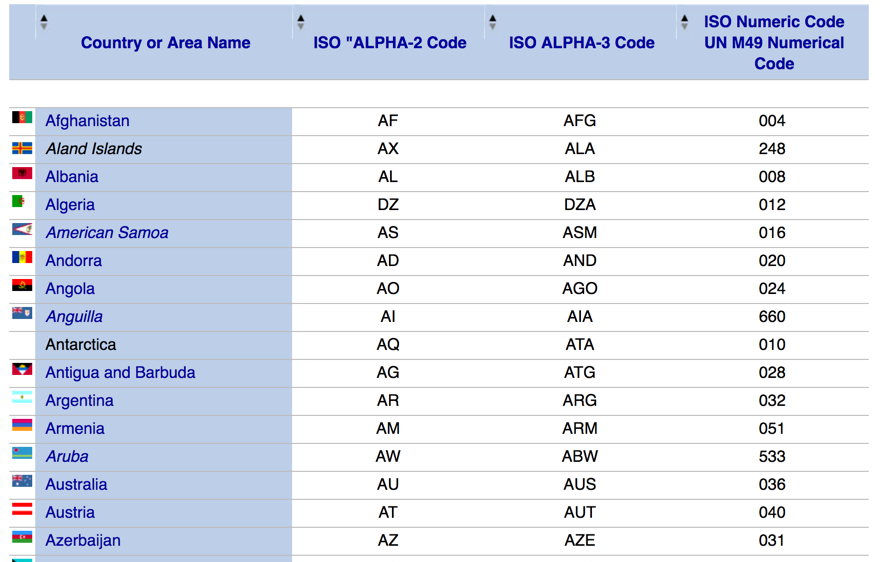
So, how we can convert this html table into a nice dataframe. Here comes pandas read_html() function. All we need to do is the following sequence of codes.
1
2
3
4
5
6
7
url = 'http://www.nationsonline.org/oneworld/country_code_list.htm'
country_codes = pd.read_html(url)
country_codes.columns = country_codes.iloc[0]
country_codes= country_codes.loc[2:,
	['Country or Area Name', 'ISO ALPHA-3 Code']]
country_codes.reset_index(drop=True,inplace=True)
country_codes.columns = ['country', 'code']
In line # 2, read_html returns a list of html output and upon investigation we find the third element is the table we are interested in. But, still we have a problem, let us display the shape of our dataframe after executing line # 2.
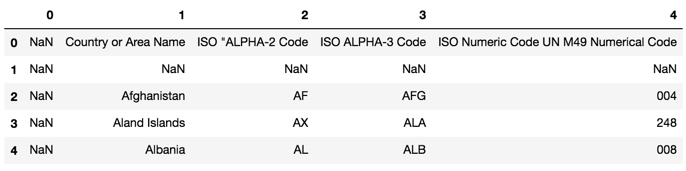
So, the header of the dataframe is in the row with index number 0. Line # 3, renames the columns with the first row country_codes.iloc[0]. Then, line # 4 ignores the unwanted first two rows and considers rows # 2 and onwards, also it ignores all columns except the two selected, i.e., country name and the code. So, by now, our dataframe looks like following.
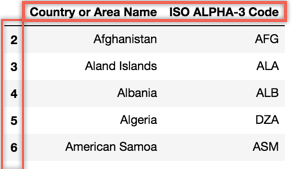
All we need now is to reset_index (line # 6) and give shorter names to our columns (line # 7). The final shape of our datafarme country_codes is as follows.
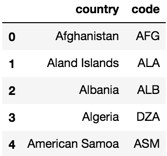
So, let us create a small function that returns the country code given the name of a country.
def get_code(country):
    return country_codes.loc[country_codes.country==country,'code'].values[0]
Here is a test call to this function
get_code('Bangladesh')
'BGD'
Scrapping html table of SDG data
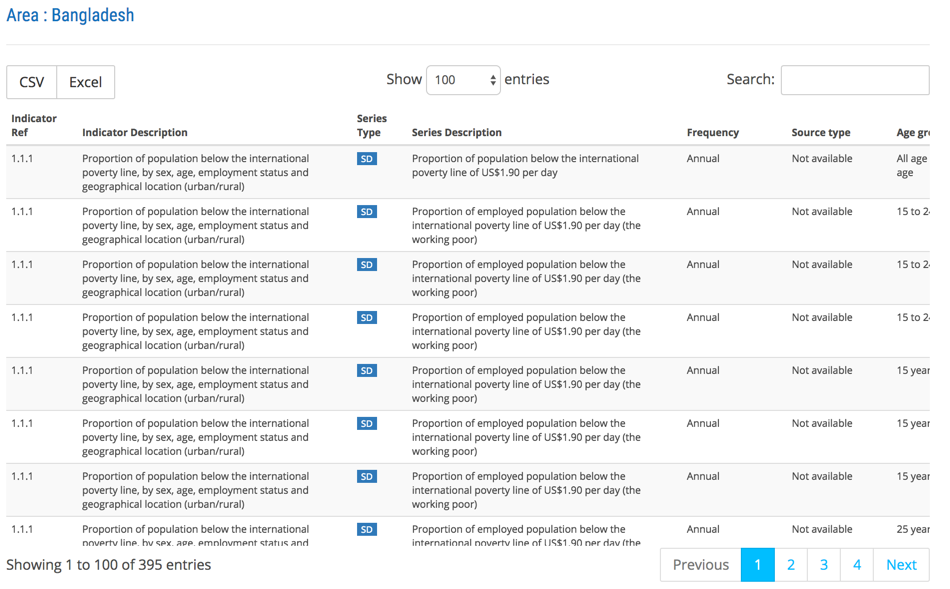
When we visit a country data from the SDG site, here is the look of a typical table.
Let us see the shape of the dataframe when we download the table from SDG site using read_html.
url = 'https://unstats.un.org/sdgs/indicators/database/?area=' + get_code('Bangladesh')
data = pd.read_html(url)
data = data[0]
data.head()
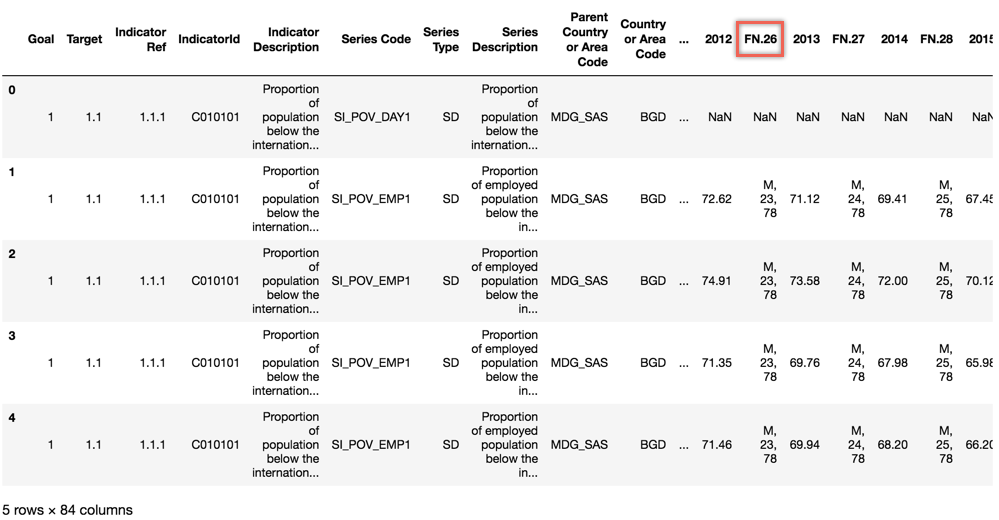
It is rather a big table with 84 columns. Luckily, we can get rid of many unwanted columns (at least for the sake of our analysis here), for example, lots of footnote information which are preserved in column headings starting with FN. Here is how we can do that.
keep_cols = [c for c in data.columns if c[:2] != 'FN']
data = data[keep_cols]
Melting dataframe
As you can see, our dataframe lists SDG indicator values horizontally for each year which appears in column headings. We want to list a single observation for a single year as a single row. Thus, we want to melt our dataframe. Refer to the documentation of melt function for more information. Here is the way:
1
2
id_cols = data.columns[:22]
data = pd.melt(data, id_vars=id_cols, var_name='Year', value_name='value')
Basically, we need to identify the ID columns which will repeat for each row (in our case all columns from 0 to 22 ). Here is the shape of the dataframe after melting.
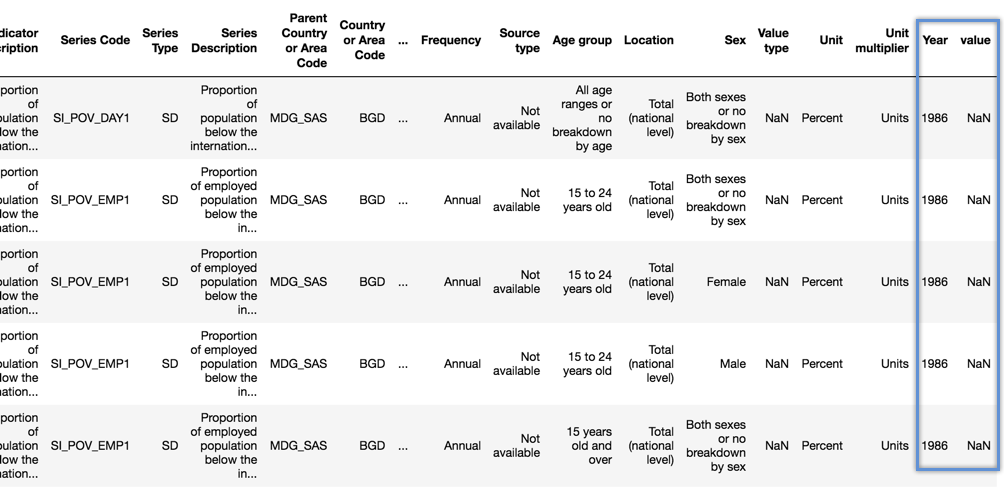
Now, let us reduce the number of columns to the ones we need for our intended analysis and get rid of others. Here is how we do that, and a sample shape of the dataframe afterwards.
data = data[['Goal', 'Series Code', 'Series Description',
	'Value type','Unit', 'Year', 'value']]
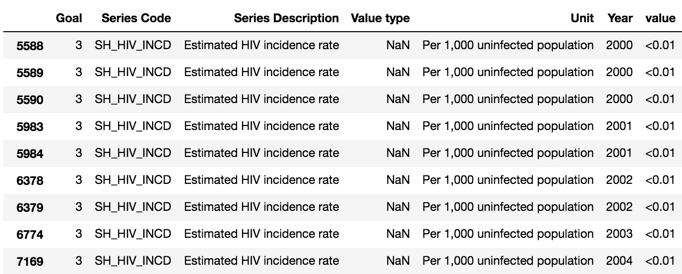
I have deliberately chosen the above image to highlight that values that has < sign which need to be cleaned and our value column need to be converted into numeric. This is done through the following code.
data['value']=[x.replace('<','') if isinstance(x,str) else x for x in data['value'].values ]
data['value']=[x.replace('>','') if isinstance(x,str) else x for x in data['value'].values ]
data['value'] = pd.to_numeric(data['value'])
Getting mean of upper and lower values
In our data sometimes certain SDG indicators quote lower and upper values. We can find them in our Value type column as follows.
data3.loc[data3['Value type'].notnull() & data3['value'].notnull()]
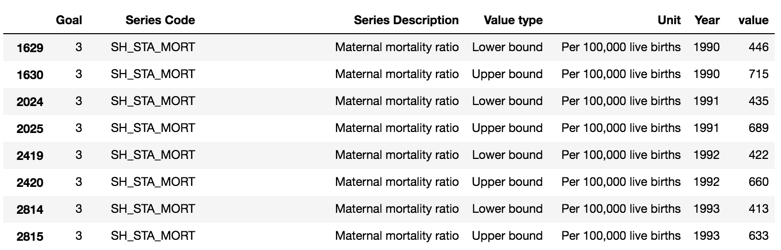
This poses unnecessary challenge for us, so I would prefer to get the mean of these two values and get rid of this column totally. Here is my idea:
data['value'] = data.groupby(['Series Code','Year'])['value'].transform('mean')
data.drop('Value type', axis=1, inplace=True)
groupby is a very powerful function. So, I am grouping by indicator code and year, and then applying the mean function. Finally, I am dropping the Value type column. You need to experiment with these helpful functions in order to understand and appreciate their power.
sdg_country function
Below is the listing of a function that takes a country code and returns a dataframe that contains all SDG indicator data. I have walked you above with each lines of this code.
1
2
3
4
5
6
7
8
9
10
11
12
13
14
15
16
17
18
19
20
21
22
23
24
25
26
27
28
29
def sdg_country(country_code):
    import pandas as pd
    url = 'https://unstats.un.org/sdgs/indicators/database/?area=' + country_code
    data = pd.read_html(url)[0]

    #get rid of footnotes
    keep_cols = [c for c in data.columns if c[:2] != 'FN']
    data = data[keep_cols]

    #melt
    ##identify the cols of ids
    id_cols = data.columns[:22]
    ##melt
    data = pd.melt(data, id_vars=id_cols, var_name='Year', value_name='value')

    #drop columns I am not intersted in
    data = data[['Goal', 'Series Code', 'Series Description', 'Value type','Unit', 'Year', 'value']]

    #convert any non numeric
    data['value']=[x.replace('<','') if isinstance(x,str) else x for x in data['value'].values ]
    data['value']=[x.replace('>','') if isinstance(x,str) else x for x in data['value'].values ]
    data['value'] = pd.to_numeric(data['value'])

    #find the mean of upper and lower if any and drop the column called value type and remove duplicates
    data['value'] = data.groupby(['Series Code','Year'])['value'].transform('mean')
    data.drop('Value type', axis=1, inplace=True)
    data.drop_duplicates(['Series Code','Year', 'value'], inplace=True)

    return data
list_indicators function
I can use the above dataframe returned by the function sdg_country to list the available indicators for a given goal number as follows.
def list_indicators(df, goal=1):
    res = df.loc[df.Goal==goal,['Series Code', 'Series Description']]
    res.drop_duplicates(inplace=True)
    return res
Here is the way how to call this function and a sample output.
sau = sdg_country(get_code('Saudi Arabia'))
list_indicators(sau,9)
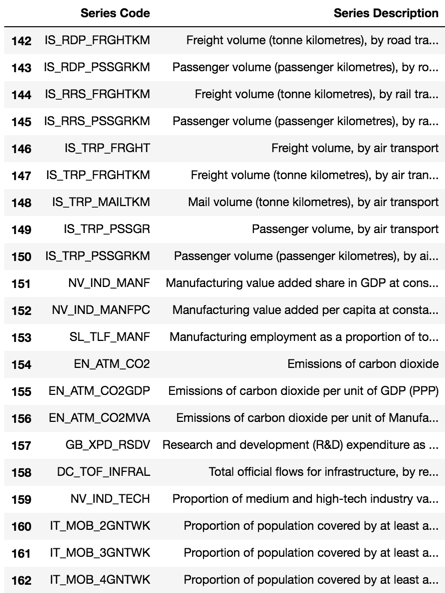 Available indicators for SDG Goal # 9 for Saudi Arabia
indicator_data function
Another handy function would take an indicator code and return me four important data about this indicator:
- list of years
Year - indicator values
value - name of the indicator
Series Description - unit of the indicator
Unit
Note that the above information are the essential elements to draw a trend line as we will see shortly.
def indicator_data(df, indicator_code):
    res = df.loc[df['Series Code']==indicator_code]
    return (res['Year'].values,
    	res['value'].values,
    	res['Series Description'].values[0],
    	res['Unit'].values[0])
indicator_data(sau,'IT_MOB_4GNTWK')
(array(['1990', '1991', '1992', '1993', '1994', '1995', '1996', '1997',
    '1998', '1999', '2000', '2001', '2002', '2003', '2004', '2005',
    '2006', '2007', '2008', '2009', '2010', '2011', '2012', '2013',
    '2014', '2015', '2016'], dtype=object),
 	array([ nan,  nan,  nan,  nan,  nan,  nan,  nan,  nan,  nan,  nan,  nan,
     nan,  nan,  nan,  nan,  nan,  nan,  nan,  nan,  nan,  nan,  nan,
     nan,  nan,  82.,  85.,  nan]),
 	'Proportion of population covered by at least a 4G mobile network',
 	'Percent')
plot_goal function
The previous two functions can be used to loop through each indicators in a SDG goal and plot them one by one. In order to present these multiple trend line I am using the GridSpec module of matplotlib.
1
2
3
4
5
6
7
8
9
10
11
12
13
14
15
16
17
18
19
20
21
22
23
24
25
def plot_goal(df,goal,country):
    import matplotlib.pyplot as plt
    import matplotlib.gridspec as gridspec
    res = list_indicators(df,goal)
    figsize = (15, len(res)*2)
    cols = 2
    gs = gridspec.GridSpec(len(res) // cols + 1, cols)
    gs.update(hspace=0.4)
    fig1 = plt.figure(num=1, figsize=figsize)
    ax = []
    i=0
    for ind, rec in res.iterrows():
        row = (i // cols)
        col = i % cols
        x,y,t,l = indicator_data(df, rec['Series Code'])
        if (len(t)>60):
            t = t[:60] #cut off long titles
        if len(x)>0:
            ax.append(fig1.add_subplot(gs[row, col]))
            ax[-1].set_title(t)
            ax[-1].plot(x, y)
            ax[-1].set_ylabel(l)
            i = i+1
    plt.suptitle("Goal %d for %s" % (goal,country))
    plt.show()
all that is left is to glue them all sdg_country_plot
def sdg_country_plot(country,goal):
    c_code = get_code(country)
    data = sdg_country(c_code)
    plot_goal(data,goal,country)
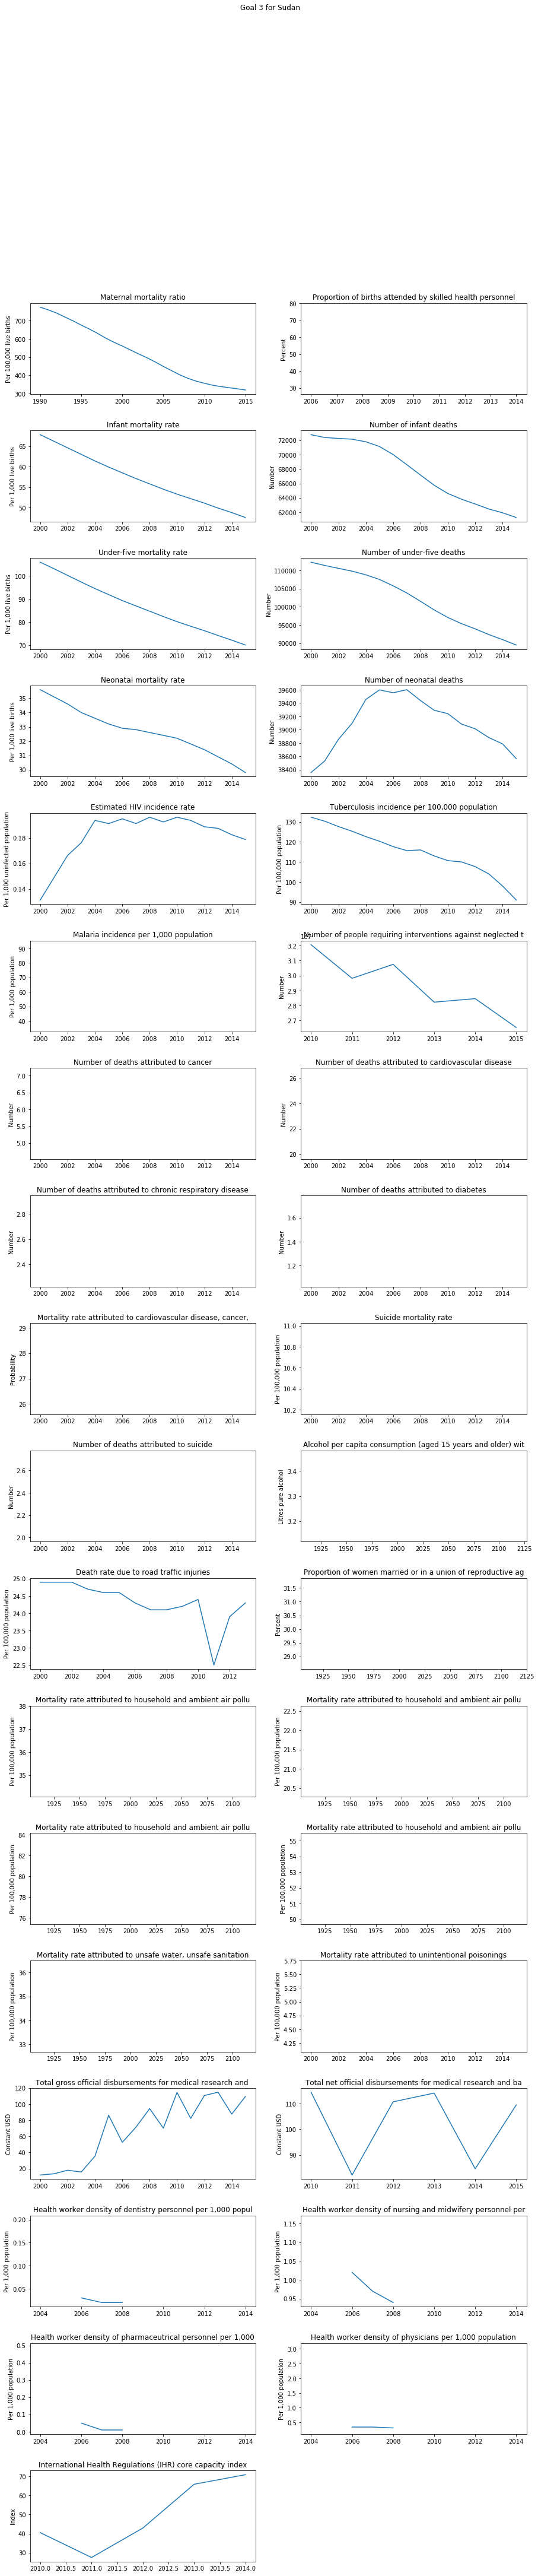
Here is a sample output for Sudan and goal 3 good health and well-being.
sdg_country_plot('Sudan', 3)
I hope this post has been beneficial to you and gave you an appreciation of the usefulness of python. You can improve on the above codes to include more validations, for example goals must be between 1 and 17. I am sharing a Jupyter Nootebook so you can take it further from here. Do comment for any errors or improvements.