Introduction
United States emerged from the World War II as a new super power replacing Great Britain. It started to poke its nose on other countries matters in order to show the world that a new sheriff is in town. This attitude amplified further when the cold war started and poor countries became a playground for proxy wars between USA and USSR.
Lots of books document the events of these period, but numbers speak louder than just texts. In this article I would like to dig deeper into the public dataset maintained by the US Aid website. It is intended to demonstrate data exploration methods in python starting from downloading the dataset available as csv file, then cleaning and preprocessing the file, to creating visualizations, to finally seeking historical and political explanations.
Preprocessing Data
I first downloaded the complete file which was above 500 MB containing detailed US Aid data since 1946 till today. The file is kept in my root directory as us_foreign_aid_complete.csv.
It is often good to open the file in excel (or any other spreadsheet tool) and have a quick look through the various columns and see if anything appears fishy.
I noticed that the field fiscal_year has strange years 1976tq, which denote some transition quarters as explained in website’s FAQ. Mixed data-types are always problem for analysis. We can either decide to ignore these years containing transition quarters, or we can rename these records to a normal 1976 year. I have decided to opt for this second option, as I am not interested to preserve this transition quarter information.
Sometimes Unix commands can be much efficient is achieving certain tasks which otherwise would be very daunting and time consuming, especially when dealing with big files such as the one we have at our hand. I am using Jupyter notebook to run my python experiments which allows me to run terminal commands straight from my notebook.
Here is the Unix way to go inside a file and replace all instances of 1976tq to 1976. See this stackoverflow hint for help.
!sed -i '' -e "s/1976tq/1976/g" us_foreign_aid_complete.csv
Next, I will read the file into a pandas DataFrame using read_csv function. DataFrames are powerful data analysis tool in python that contains ready-made analysis function as we will see shortly. The following code shows that python loaded the csv file successfully, however, during loading, python returns some warning about two columns that still has mixed datatypes.
import pandas as pd
import numpy as np

file_address = 'us_foreign_aid_complete.csv'
usaid_data = pd.read_csv(file_address)
/Users/abaqi/anaconda/lib/python3.6/site-packages/IPython/core/interactiveshell.py:2717: DtypeWarning: Columns (43,44) have mixed types. Specify dtype option on import or set low_memory=False.
  interactivity=interactivity, compiler=compiler, result=result)
It is clear that columns 43 and 44 are of mixed types. How to know their names? We can display all column names as follows.
usaid_data.columns
Index(['country_id', 'country_code', 'country_name', 'region_id',
       'region_name', 'income_group_id', 'income_group_name',
       'income_group_acronym', 'implementing_agency_id',
       'implementing_agency_acronym', 'implementing_agency_name',
       'implementing_subagency_id', 'subagency_acronym', 'subagency_name',
       'channel_category_id', 'channel_category_name',
       'channel_subcategory_id', 'channel_subcategory_name', 'channel_id',
       'channel_name', 'dac_category_id', 'dac_category_name',
       'dac_sector_code', 'dac_sector_name', 'dac_purpose_code',
       'dac_purpose_name', 'funding_account_id', 'funding_account_name',
       'funding_agency_id', 'funding_agency_name', 'funding_agency_acronym',
       'assistance_category_id', 'assistance_category_name',
       'aid_type_group_id', 'aid_type_group_name', 'activity_id',
       'activity_name', 'activity_project_number', 'activity_start_date',
       'activity_end_date', 'transaction_type_id', 'transaction_type_name',
       'fiscal_year', 'current_amount', 'constant_amount', 'USG_sector_id',
       'USG_sector_name', 'submission_id', 'numeric_year'],
      dtype='object')
And we can reach directly to our intended two column through their index number as follows.
usaid_data.columns[43:45]
Index(['current_amount', 'constant_amount'], dtype='object')
Upon investigating, we find that the columns current_amount and constant_amount list amounts as strings that has , separators for millions, thousands and etc, but this columns also list amounts less than one thousand as normal float values. There is a good converter in pandas called to_numeric. However, when a string amount has commas, to_numeric gets confused and returns errors.
To get around we must first remove these comma separators using replace function within a list comprehension. However, this columns has mixed type so we need to be conditional in this replacement. Following code makes these changes for both of current_amount and constant_amount columns.
usaid_data['current_amount']= [x.replace(',', '') if isinstance(x, str) else x for x in usaid_data['current_amount'].values]
usaid_data['current_amount']= pd.to_numeric(usaid_data['current_amount'])

usaid_data['constant_amount']= [x.replace(',', '') if isinstance(x, str) else x for x in usaid_data['constant_amount'].values]
usaid_data['constant_amount']= pd.to_numeric(usaid_data['constant_amount'])
To make sure, let us display few lines from one of these columns.
usaid_data['current_amount'].head()
0    9.941000e+09
1    9.243000e+09
2    7.840175e+09
3    7.764311e+09
4    6.928000e+09
Name: current_amount, dtype: float64
What is the size of our dataset?
usaid_data.shape
(821744, 49)
So, it has 821,744 records in 49 columns. Here is a list of the columns and their data types.
usaid_data.dtypes
country_id                       int64
country_code                    object
country_name                    object
region_id                        int64
region_name                     object
income_group_id                float64
income_group_name               object
income_group_acronym            object
implementing_agency_id           int64
implementing_agency_acronym     object
implementing_agency_name        object
implementing_subagency_id        int64
subagency_acronym               object
subagency_name                  object
channel_category_id              int64
channel_category_name           object
channel_subcategory_id           int64
channel_subcategory_name        object
channel_id                       int64
channel_name                    object
dac_category_id                  int64
dac_category_name               object
dac_sector_code                  int64
dac_sector_name                 object
dac_purpose_code                 int64
dac_purpose_name                object
funding_account_id              object
funding_account_name            object
funding_agency_id                int64
funding_agency_name             object
funding_agency_acronym          object
assistance_category_id           int64
assistance_category_name        object
aid_type_group_id                int64
aid_type_group_name             object
activity_id                      int64
activity_name                   object
activity_project_number         object
activity_start_date             object
activity_end_date               object
transaction_type_id              int64
transaction_type_name           object
fiscal_year                      int64
current_amount                 float64
constant_amount                float64
USG_sector_id                    int64
USG_sector_name                 object
submission_id                    int64
numeric_year                   float64
dtype: object
If we think our dataset contains too many columns, we can delete unwanted column names like the field names ending with words like id, code or acronym.
del_list = [c for c in usaid_data.columns.str.contains(r'_id|_code|_acronym')]
import itertools
drop_list =[c for c in itertools.compress(usaid_data.columns.values, del_list)]
usaid_data.drop(drop_list,1)
What period does this dataset cover? To find answers we can use min() and max() functions with the respected column as follows.
print(usaid_data['numeric_year'].min())
print(usaid_data['numeric_year'].max())
1946.0
2017.0
So, we have 71 years of US Aid data starting from end of World War II till today. Let us see how many countries in total received aid from U.S.A. throughout these 71 years.
len(usaid_data['country_name'].unique())
253
Here is the list of countries. Note that this list contains some regions as well like ‘Middle East’. It is good to note that region names end up with the word Region, so we can grab them all if we want a specific regional analysis.
countries = usaid_data['country_name'].unique().tolist()
print(sorted(countries))
['Afghanistan', 'Albania', 'Algeria', 'Angola', 'Anguilla', 'Antigua and Barbuda', 'Argentina', 'Armenia', 'Aruba', 'Asia Region', 'Asia, Middle East and North Africa Region', 'Australia', 'Austria', 'Azerbaijan', 'Bahamas', 'Bahrain', 'Bangladesh', 'Barbados', 'Belarus', 'Belgium', 'Belize', 'Benin', 'Berlin, West', 'Bermuda', 'Bhutan', 'Bolivia', 'Bosnia and Herzegovina', 'Botswana', 'Brazil', 'British Indian Ocean Territory', 'British Virgin Islands', 'Brunei', 'Bulgaria', 'Burkina Faso', 'Burma (Myanmar)', 'Burundi', 'Cabo Verde', 'Cambodia', 'Cameroon', 'Canada', 'Caribbean Region', 'Cayman Islands', 'Central African Republic', 'Central America Region', 'Central America and Caribbean Region', 'Central and Eastern Europe Region', 'Chad', 'Chile', 'China (P.R. Hong Kong)', 'China (P.R.C.)', 'China (Tibet)', 'China, Republic of (Taiwan)', 'Colombia', 'Comoros', 'Congo (Brazzaville)', 'Congo (Kinshasa)', 'Cook Islands', 'Costa Rica', "Cote d'Ivoire", 'Croatia', 'Cuba', 'Curacao', 'Cyprus', 'Czechia', 'Czechoslovakia (former)', 'Denmark', 'Djibouti', 'Dominica', 'Dominican Republic', 'East Asia and Oceania Region', 'East and South Africa Region', 'Eastern Africa Region', 'Eastern Asia Region', 'Eastern Europe Region', 'Eastern and Central Africa Region', 'Ecuador', 'Egypt', 'El Salvador', 'Equatorial Guinea', 'Eritrea', 'Estonia', 'Ethiopia', 'Eurasia Region', 'Europe Region', 'Europe and Eurasia Region', 'Fiji', 'Finland', 'France', 'French Guiana', 'French Polynesia', 'Gabon', 'Gambia', 'Georgia', 'Germany', 'Germany (former East)', 'Ghana', 'Greece', 'Grenada', 'Guatemala', 'Guinea', 'Guinea-Bissau', 'Guyana', 'Haiti', 'Honduras', 'Hungary', 'Iceland', 'India', 'Indonesia', 'Iran', 'Iraq', 'Ireland', 'Israel', 'Italy', 'Jamaica', 'Japan', 'Jordan', 'Kazakhstan', 'Kenya', 'Kiribati', 'Korea Republic', 'Korea, Democratic Republic', 'Kosovo', 'Kuwait', 'Kyrgyzstan', 'Laos', 'Latin America Region', 'Latin America and Caribbean Region', 'Latvia', 'Lebanon', 'Lesotho', 'Liberia', 'Libya', 'Lithuania', 'Luxembourg', 'Macau', 'Macedonia', 'Madagascar', 'Malawi', 'Malaysia', 'Maldives', 'Mali', 'Malta', 'Marshall Islands', 'Martinique', 'Mauritania', 'Mauritius', 'Mexico', 'Micronesia (Federated States)', 'Middle East Region', 'Middle East and North Africa Region', 'Moldova', 'Mongolia', 'Montenegro', 'Montserrat', 'Morocco', 'Mozambique', 'Namibia', 'Nauru', 'Nepal', 'Netherlands', 'Netherlands Antilles (former)', 'New Caledonia', 'New Zealand', 'Nicaragua', 'Niger', 'Nigeria', 'North Africa Region', 'North America Region', 'North and Central America Region', 'Norway', 'Oceania Region', 'Oman', 'Pacific Island Trust Territory', 'Pakistan', 'Palau', 'Panama', 'Papua New Guinea', 'Paraguay', 'Peru', 'Philippines', 'Poland', 'Portugal', 'Qatar', 'Romania', 'Russia', 'Rwanda', 'Samoa', 'Sao Tome and Principe', 'Saudi Arabia', 'Senegal', 'Serbia', 'Serbia and Montenegro (former)', 'Seychelles', 'Sierra Leone', 'Singapore', 'Slovak Republic', 'Slovenia', 'Solomon Islands', 'Somalia', 'South Africa', 'South America Region', 'South East Asia Region', 'South Sudan', 'South and Central Asia Region', 'Southern Africa Region', 'Southern Asia Region', 'Soviet Union (former)', 'Spain', 'Sri Lanka', 'St. Kitts and Nevis', 'St. Lucia', 'St. Vincent and Grenadines', 'Sub-Saharan Africa Region', 'Sudan', 'Sudan (former)', 'Suriname', 'Swaziland', 'Sweden', 'Switzerland', 'Syria', 'Tajikistan', 'Tanzania', 'Thailand', 'Timor-Leste', 'Togo', 'Tonga', 'Trinidad and Tobago', 'Tunisia', 'Turkey', 'Turkmenistan', 'Turks and Caicos Islands', 'Tuvalu', 'Uganda', 'Ukraine', 'United Arab Emirates', 'United Kingdom', 'Uruguay', 'Uzbekistan', 'Vanuatu', 'Venezuela', 'Vietnam', 'Vietnam (former South)', 'West Africa Region', 'West Bank/Gaza', 'Western (Spanish) Sahara', 'Western Europe Region', 'Western Hemisphere Region', 'World', 'Yemen', 'Yemen (former P.D.R.)', 'Yugoslavia (former)', 'Zambia', 'Zimbabwe']
Building handy data exploration functions
country_aid
Let us see how much a particular country gets from U.S. as aids in a particular year. I have placed this inside a function that takes a country name and year (defaulted to 2015) and transaction type (defaulted to ‘Obligation’) and returned the sum of all aides in that year. Note, that I have used the format_currency module from babel.numbers to return a better formatted number.
def country_aid(country, year=2015, type='Obligations', format='c'):
    mask_country = usaid_data['country_name']== country
    mask_transaction = usaid_data['transaction_type_name']==type
    mask_year = usaid_data['fiscal_year']==year
    res = usaid_data.loc[mask_country & mask_transaction & mask_year]
    result = res.loc[:,'current_amount'].sum()
    if format=='c':
        from babel.numbers import format_currency
        return(format_currency(result, 'USD', locale='en_US'))
    else:
        return result
The method is pretty simple: use as many masks (i.e., filter) as needed and create a small subset of the big dataframe usaid_data. Then select the intended column and sum the values res.loc[:,'current_amount'].sum() as shown above.
Let us test this function.
country_aid('Iran', 2015, format='c')
'$674,800.00'
Iran received almost $675k in the year 2015.
Let us leverage on this function to create a list of aid amounts for a range of years: 2001 to 2015. Again list comprehension comes to the aid.
[country_aid('Bangladesh', x, format='n') for x in range(2001,2015)]
[135806219.0,
 95710112.0,
 83288947.0,
 74586321.0,
 77421854.0,
 74584189.0,
 61288964.0,
 160577738.0,
 109213413.0,
 171884317.0,
 201283604.0,
 317781267.0,
 225356834.0,
 313992479.0]
country_aid_activities
It would be good to trace major activities for which aid is given. Our dataset captures activities under field called activity_name. Here is a function that does that. After applying relevant filters, we groupby and then aggregate using pandas build-in functions.
def country_aid_activities(country, year=2015, type='Obligations', format='c'):
    mask_country = usaid_data['country_name']== country
    mask_transaction = usaid_data['transaction_type_name']==type
    mask_year = usaid_data['fiscal_year']==year
    res = usaid_data.loc[mask_country & mask_transaction & mask_year]
    res = res.groupby('activity_name').agg('sum')
    res = res.filter(['activity_name', 'current_amount'], axis=1)
    return res.sort_values('current_amount', ascending=False)[:10]
For example here are the top activities for aids in Bangladesh (in the year 2015).
country_aid_activities('Bangladesh')
| current_amount | activity_name |
|---|---|
| NGO Health Service Delivery Project (NHSDP) | 20263805.0 |
| CGIAR Fund grant with the World Bank. | 20155962.0 |
| Administrative costs | 15586352.0 |
| MaMoni Health System Strengthening (HSS) program | 12400000.0 |
| Grant to World Bank's Bangladesh Health Sector Development Program (HSDP) | 9000000.0 |
| Agricultural Extension Support Activity | 8500000.0 |
| Agriculture Value Chains | 7395118.0 |
| Climate-Resilient Ecosystems and Livelihoods (CREL) | 7000000.0 |
| Accelerating Agriculture Productivity Improvement (AAPI) | 6392871.0 |
| Administration and Oversight | 6288054.0 |
No doubt that Administrative Costs together carry big tickets. I wish I could dig deeper into this and understood better why such big costs incur.
plot_trend
Let us put together these snippets to create a function that plots US Aid to a given country for a given time period. matplotlib comes to our aid. Here I am just using the basic settings. Feel free to explore the documentation and spice-up your vizzes with fancy customizations.
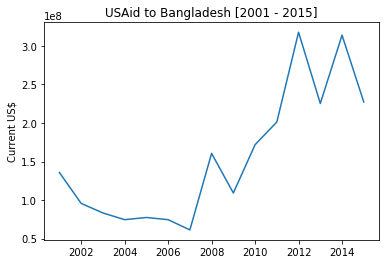
def plot_trend(country, start=2001, end=2015):
    %matplotlib inline
    import matplotlib.pyplot as plt
    amts = [country_aid(country, x, format='n') for x in range(start,end+1)]
    fig, axis = plt.subplots()
    title = "USAid to %s [%d - %d]" %(country, start, end)
    plt.title(title)
    plt.ylabel('Current US$')
    axis.plot(range(start,end+1), amts)
Note from the function definition that start and end values are defaulted to 2001 and 2015 respectively. Let us test this function.
plot_trend('Bangladesh')
Following function call would return trend of US Aid to Saudi Arabia from 1946 till the default year 2015.
plot_trend('Saudi Arabia', 1946)
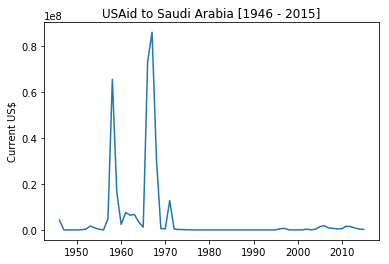
It is clear that Saudi Arabia received lots of aids in late 50s and 60s. One then can start investigating historical events to seek an explanation as why that was the case? Please help me in the comment below to give your explanation.
Sample Application: Military Vs. Economic Aids
Our dataset has a column called assistance_category_name that classifies each aid to either Economic or Military. The following function reuses the previous country_aid function to return the aid amount by category.
def country_aid_cat(country, cat='Economic', year=2015, type='Obligations', format='c'):
    mask_country = usaid_data['country_name']== country
    mask_transaction = usaid_data['transaction_type_name']==type
    mask_year = usaid_data['fiscal_year']==year
    mask_cat = usaid_data['assistance_category_name']==cat
    res = usaid_data.loc[mask_country & mask_transaction & mask_year & mask_cat]
    result = res.loc[:,'current_amount'].sum()
    if format=='c':
        from babel.numbers import format_currency
        return(format_currency(result, 'USD', locale='en_US'))
    else:
        return result
For example, US military aid to Bangladesh in 2015 was:
country_aid_cat('Bangladesh', cat='Military')
'$4,460,403.00'
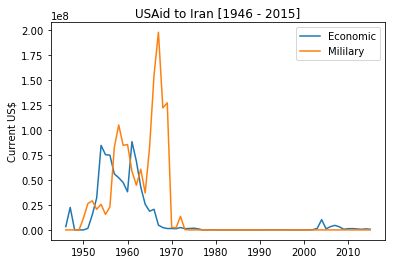
plot_trend_cat
Taking similar approach as before and stepping on the strong shoulder of python’s list comprehension we can build a trend chart that depicts the progress of US Aid to a country classified by Economic or Military.
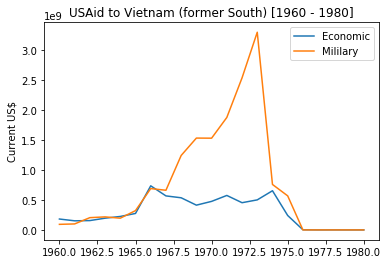
def plot_trend_cat(country, start=2001, end=2015):
    %matplotlib inline
    import matplotlib.pyplot as plt
    amts_econ = [country_aid_cat(country,'Economic', x, format='n') for x in range(start,end+1)]
    amts_mil = [country_aid_cat(country,'Military', x, format='n') for x in range(start,end+1)]
    fig, axis = plt.subplots()
    title = "USAid to %s [%d - %d]" %(country, start, end)
    plt.title(title)
    plt.ylabel('Current US$')
    axis.plot(range(start,end+1), amts_econ)
    axis.plot(range(start,end+1), amts_mil)
    plt.legend(['Economic', 'Mililary'])
    plt.show()
Here is a test call to this function, showing the classification of US Aid to Vietnam around the time of US War.
plot_trend_cat('Vietnam (former South)', 1960,1980)
Ratio of Military aids
assistance_category_name specifies military or economic classification of the aid. Let us tweak the previous function to find out what % of USAid to a country goes for military purposes.
def aid_category(country, year_start=1946, year_end=2015, type='Obligations'):
    mask_country = usaid_data['country_name']== country
    mask_transaction = usaid_data['transaction_type_name']==type
    mask_year_start = usaid_data['fiscal_year']>=year_start
    mask_year_end = usaid_data['fiscal_year']<=year_end
    res = usaid_data.loc[mask_country & mask_transaction & mask_year_start & mask_year_end]
    total = res.loc[:,'current_amount'].sum()
    res2 = res.groupby('assistance_category_name').agg('sum')
    try:
        return res2.loc[:, 'current_amount'][1]/total * 100
    except:
        return 0
In this function I am leveraging on the power of groupby function of data frame in pandas. It basically groups the data after applying the filters into the two categories, i.e., Economic and Military. Then, the entire result set are aggregated to give grand totals by these two categories: res.groupby('assistance_category_name').agg('sum'). Therefore, our result has only two records (the first at index 0 for Economic and the second at index 1 for Military). Thus, we can easily find the percent value of military aids as: res2.loc[:, 'current_amount'][1]/total * 100.
Here is the % of Military aid from total aids to Bangladesh in 2015.
aid_category('Bangladesh')
2.4347220694965599
Which countries Uncle Sam prefers for Military aids
Using this we can build a dictionary of all countries and the proportion of military aid from USA.
countries = usaid_data['country_name'].unique().tolist()
dic = {}
for c in countries:
    dic[c]= aid_category(c)
To find the top countries, all we need is to find a way to sort this dictionary by values. Find the resulted list below. For example, from total aids since inception, Bahrain got 97.2% of all US Aids as military aids.
sorted(dic.items(), key=lambda x: x[1], reverse=True)
[('St. Kitts and Nevis', 100.00428363606228),
 ('Curacao', 99.904432961763931),
 ('Antigua and Barbuda', 99.206773498814798),
 ('St. Lucia', 98.836467569324327),
 ('Bahrain', 97.151815367742358),
 ('Dominica', 96.787166995978339),
 ('St. Vincent and Grenadines', 94.38100274177053),
 ('Eastern and Central Africa Region', 92.552264808362366),
 ('Australia', 92.412124121094166),
 ('Saudi Arabia', 86.898365009737248),
 ('Greece', 82.721206867578061),
 ('Norway', 75.728808760037921),
 ('Poland', 75.575482967325712),
 ('Spain', 74.06147116752787),
 ('Israel', 72.100419665785978),
 ('Maldives', 70.197342072420696),
 ('Denmark', 69.415970234929063),
 ('Turkey', 68.947439702633403),
 ('Europe and Eurasia Region', 68.864161583741208),
 ('Vietnam (former South)', 68.31041762487834),
 ('Afghanistan', 66.392871140444569),
 ('Tuvalu', 65.376141013534777),
 ('Slovenia', 65.350594923200973),
 ('Belgium', 64.970680719896052),
 ('China, Republic of (Taiwan)', 64.647094723273952),
 ('Iran', 63.35990432065757),
 ('Estonia', 63.354728391547987),
 ('Bahamas', 63.345132718837938),
 ('Oman', 61.579931410223942),
 ('Latvia', 60.602116610293407),
 ('Czechia', 60.052293643028079),
 ('Middle East Region', 59.737086781560436),
 ('Korea Republic', 59.206823611238555),
 ('Laos', 58.635280326684899),
 ('Egypt', 58.020134268369482),
 ('Netherlands', 55.353231985599017),
 ('Portugal', 54.446502645075491),
 ('Thailand', 53.640725637458189),
 ('France', 53.618328354763825),
 ('Argentina', 53.065160268770825),
 ...
 # more results truncated
How about if we want to find the top countries by $ values. Here again we proceed with the same building block approach.
We first define a function to return military aids since 1946 for an individual country.
def military_aid(country, year_start=1946, year_end=2015, type='Obligations'):
    mask_country = usaid_data['country_name']== country
    mask_transaction = usaid_data['transaction_type_name']==type
    mask_year_start = usaid_data['fiscal_year']>=year_start
    mask_year_end = usaid_data['fiscal_year']<=year_end
    mask_aid_category = usaid_data['assistance_category_name']=='Military'
    res = usaid_data.loc[mask_country & mask_transaction & mask_year_start & mask_year_end & mask_aid_category]
    total = res.loc[:,'current_amount'].sum()
    return total
military_aid('Bangladesh')
165102366.0
Then, we use this function to iterate throughout the list of all countries and build a dictionary of $ values of military aids.
countries = usaid_data['country_name'].unique().tolist()
dic2 = {}
for c in countries:
    dic2[c]= military_aid(c)
Finally, we sort the dictionary by values and find the top champions.
mil = sorted(dic2.items(), key=lambda x: x[1], reverse=True)
mil
[('Israel', 88517785997.0),
 ('Afghanistan', 59329348003.0),
 ('Egypt', 44723653507.0),
 ('Iraq', 23656350146.0),
 ('Vietnam (former South)', 16300044000.0),
 ('Turkey', 13010664333.0),
 ('Greece', 9306904696.0),
 ('Korea Republic', 8911728664.0),
 ('World', 7546838010.0),
 ('Pakistan', 7541247863.0),
 ('Jordan', 6716272819.0),
 ('Poland', 4577662215.0),
 ('France', 4551269677.0),
 ('China, Republic of (Taiwan)', 4381778000.0),
 ('Russia', 4034833440.0),
 ('Colombia', 3538831049.0),
 ('Spain', 3442136329.0),
 ('Italy', 2547963142.0),
 ('Philippines', 2546559825.0),
 ('Thailand', 2358886036.0),
 ('Portugal', 1658334889.0),
 ('Laos', 1602655542.0),
 ('Europe and Eurasia Region', 1435306945.0),
 ('Iran', 1412516000.0),
 ('Cambodia', 1333231109.0),
 ('Netherlands', 1285097201.0),
 ('Morocco', 1275689140.0),
 ('Belgium', 1275040918.0),
 ('Japan', 1239650638.0),
 ('Somalia', 1213298876.0),
 ...
 # more lines truncated

 ('Montserrat', 0)]
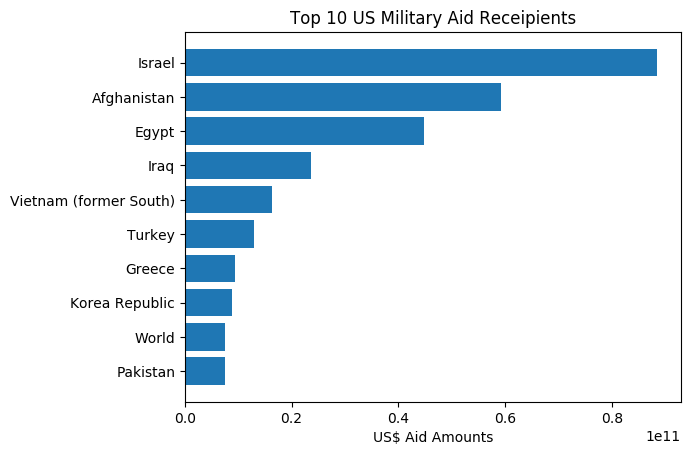
Not surprising that Israel is the all-time champion with the figure of 88.5 billion US Dollars! With the power of data, one never needs to resort to conspiracy kind of theory to prove Israel Lobby and its influence on the US foreign policy.
Just to spice-up our presentation, why not visualize the above data through horizontal bar chart.
To do this, we first need to prepare the top 10 country names from the first element of the tuple. Note that our data above is saved in a variable called mil as tuples of two elements: country name and aid value. Again, handy python list comprehension allows us to extract list our of this tuple in preparation for input to matplotlib functions.
top10countries = [x for x,y in mil][:10]
amts = [y for x,y in mil][:10]
So, the above two variables top10countries and amts are clean list of 10 countries and aid values. All we need now is to plot the values specifying correct settings and parameters.
import matplotlib.pyplot as plt
import numpy as np

plt.rcdefaults()
fig, ax = plt.subplots()

y_pos = np.arange(len(top10countries))
error = np.random.rand(len(top10countries))

ax.barh(y_pos, amts, xerr = error,
        align='center',
        ecolor='black')
ax.set_yticks(y_pos)
ax.set_yticklabels(cc)
ax.invert_yaxis()  # labels read top-to-bottom
ax.set_xlabel('US$ Aid Amounts')
ax.set_title('Top 10 US Military Aid Receipients')

plt.show()
Country Analysis
I recently started reading a book by Peter Frankopan titled The Silk Roads. Chapter 22 talks about US Foreign policy discussed through the title heading: The Road to Cold Warfare. I confess that this data analysis investigation was triggered by this chapter.
Iran
Prior to the World War II, Britain used to be the master thief robbing Iran of its oil via its Anglo Persian Oil Company. This company operated much like the British East Indian company showing no respect to the interest of local population. After 1950, under the leadership of the prime minister Mossadegh, Iranians went on to nationalize the company. This infuriated British and along with the help of USA worked hard to change Mossadegh. Here we find the popular tool of the CIA whenever it wants to change a leader: pour money to arrange a coup.
Let us zoom into this period and see the US Aid to Iran during 50s.
plot_trend_cat('Iran', 1950, 1960)
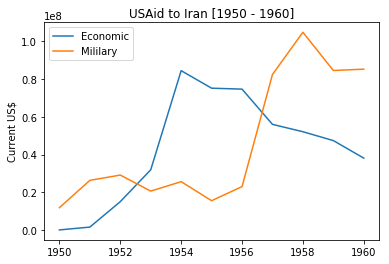
Let us read what Frankopan had to say about the US Aids during this period. (Silk Roads, p.416)
According to one eyewitness, the flood of American currency into Teheran [sic] was so great that the value of the dollar relative to the rial fell by nearly 40 per cent during the summer of 1953. Some of these funds were spent paying for crowds to march on the streets of the capital, organised by the CIA’s two main local operatives.
After the coup ousting Mossadegh, US started to compete with USSR to win the hearts and minds of the population. That is why we find a surge in non-Military social activities focusing on large rural population with agriculture, farming and food production activities.
Let us utilize our function defined earlier to tap into major activities of US Aid to Iran, for example in the year 1956.
country_aid_activities('Iran', 1956)
| current_amount | activity_name |
|---|---|
| ESF | 57500000.0 |
| USAID Grants | 55500000.0 |
| Military Assistance Program (MAP) | 21180000.0 |
| USAID Loans | 10000000.0 |
| Title I Food for Peace Grants (LCU) | 5900000.0 |
| Title I Food For Peace Loans (LCU) | 2400000.0 |
| Int'l Military Education & Training | 1211000.0 |
| Title II Development Programs | 900000.0 |
| Transfers from Excess Stock | 600000.0 |
| ESF adjustment for USAID Loans and Grants | -57500000.0 |
Unfortunately, USAid did not keep detailed transactions but lumped big chunks under headings like ESF and USAID Grants. Nevertheless, one could see from the table above the general focus on social and agricultural activities during that period. Again Frankopan described this mood (The Silk Roads, p. 421):
Direct aid from the US government rose sharply too, rising from an annual average of $27 million in the years before the removal of Mossadegh to a figure nearly five times higher in the years that followed.
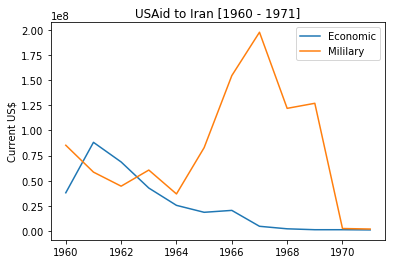
Then came the 60s bringing with it the Cold War to its hottest period. Iran stood at a strategic location drawing the attention of both USSR and USA. Attention of Shah intensified on military procurement. Again, in the words of Frankopan (The Silk Roads, p. 435)
And the Shah developed increasingly grandiose plans that made matters even worse. Vast amounts were invested in the military, with Iran’s military spending rising from $293 million in 1963 to $7.3 billion less than fifteen years later.
Let us confirm this with looking into this period using our line chart.
plot_trend_cat('Iran', 1960, 1971)
Israel
It is worth to investigate the all-time champion: Israel. Strange enough, Israel is one of the richest countries, and yet THE top recipient of US Aid. This can only be explained by thinking these two countries’ relationship as a father-son rather than a donor-beneficiary relation. Israel is like a spoiled child of USA. Whenever USA apparently favors some Middle East countries as collateral byproduct of oil politics through some aids, it has to please Israel the next day with at least ten times that amount. This is very evident in the $38 billion aid package pledged by Obama in 2016 just to please Israel after improving relations with Iran.
To better understand this I like to investigate US Aid to Israel by comparing that with the aid given to Palestine (in our dataset it is called West Bank/Gaza) from 1970 till today.
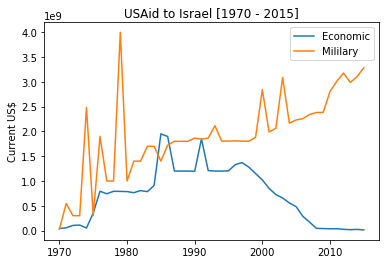 |
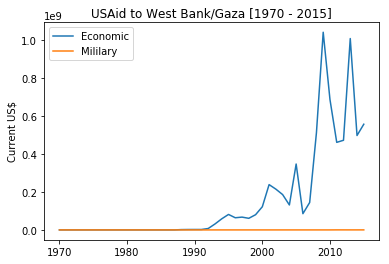 |
It is evident from these pictures that: first, Palestine gets 0% of US military aid while Israel gets almost 100%. Second, over time US Aid to Israel is shifting towards military aid while the economic aid is declining.
Moreover, if we see the economic aid activities to West Bank and Gaza we would find a big chuck goes to settle private debts which again goes to Israel. Let us see some of these aid activities to Palestine for the year 2016.
country_aid_activities('West Bank/Gaza', 2016)
| activity_name | current_amount |
|---|---|
| Private Sector Debt Payments | 75000000.0 |
| Crisis Assistance and Recovery | 44999999.0 |
| Water Supply and Sanitation | 27511257.0 |
| Compete | 18205718.0 |
| Transport Services | 17316275.0 |
| Administration and Oversight | 15718087.0 |
| Administrative costs | 13222704.0 |
| PIO Grant to the World Food Programme | 12000000.0 |
| Palestinian Community Infrastructure Development Program (PCID) | 11000000.0 |
| Infrastructure Needs Construction Management Program Phase II - Task Order for Architecture and Engineering Services | 9921111.0 |
Third, we witness sharp peaks of aids in the 70s, so, Let us zoom in this period.
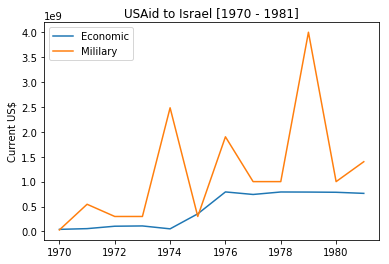
It is not difficult to understand the surge in military aid to Israel in the 70s, and who can provide answer better than Noam Chomsky. Reading Understanding Power we can find at least two answers.
- Serve as a mercenary state for USA
Here is one excerpt from Chomsky (Understanding Power, p. 126)
And in the 1970s and Eighties, the United States increasingly turned to Israel as kid of a weapon against other parts of the Third World – Isreal would provide armaments and training and computers and all sorts of other things to the Third World dictatorships at times when it was hard for the U.S. government to give that support directly… and that’s another reason why Israel gets such extraordinary amounts of U.S. aid.
- Secure Israel from hostile Arab neighbors
After Egypt’s 1973 war, US and Israel were surprised to see that Arabs can win wars, because after the quick victory in ‘67 they were sure that Arabs have no skills to go to wars, let alone winning. Now, after Arab victory, U.S. have to comfort its spoiled child and arm it against the Arab neighbors who -after all- have skills to go for wars and win them as well! Hence, the surge of military aid during this period.
In addition, U.S. was able to pacify Sadat of Egypt and bribe him to leave Russia and join Uncle Sam and befriend Israel (hence, Camp David). It would be reasonable then in order to calculate US Aid to Israel is to add to its already huge amount the amounts given to Egypt. Let us see the US aids to Egypt from 1975.
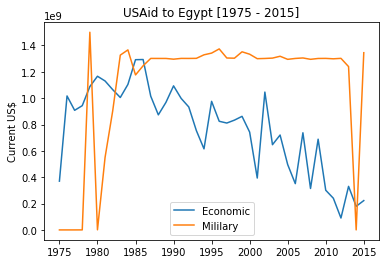
Here is an excerpt from an article by Donald Neff “Massive aid to Israel” appearing in Middle East International (July 21, 1995). Bear in mind that the figures mentioned in this excerpt has been increasing especially for Israel.
This small number [ Israel’s 5 million population] is getting about a quarter of all the money the U.S. is spending worldwide on foreign aid – not counting the additional $3.3 billion Israel receives by other means from the U.S. or the $2.2 billion the U.S. pays annually to Egypt for keeping peace with Israel.
What is next?
I have touched upon very basic stuff to get you started and demo’ed some data exploratory capabilities. You can download my Jupyter Nootebook and replicate these steps yourself.
US Aid dataset is rich with many other columns which I did not investigate. One can investigate the income categories and correlate with the sectors (like health, education, etc.). The dataset also captures agencies through which the aid is implemented, thus allowing various interesting analysis of these agencies. Aid activities in this dataset have start and end times, which again allows interesting investigation about the speed of aid activities and correlate them with other attributes like country, aid amount and agencies.
One can go even further by downloading separately external datasets related to other socio-economic and military indicators and blend it with our aid dataset thus enabling much interesting correlations and insights.
Conclusion
If a domain expert was successful to climb the learning curve of python or R then surely (s)he can produce very interesting insights and enrich his/her research with data-driven approach, thus adding credibility and authenticity to their research. Increasingly various organizations are releasing their historic datasets, but researchers in parallel need to accelerate their data exploratory skills to make good use of it. Often domain experts and researchers are restricted with spreadsheet applications like Excel. However, when encountered with big datasets (like our 900,000 rows of data) excel feels the burden and often gives up.
U.S. Aid website allows on-line query tool and visualizations but it is never equivalent to the freedom one gets when downlaoding the entire dataset and making their own analysis. For example, most of the visualizations in the US Aid website are given since 2001, so you can not rely on it to study the aid flows during cold war.
In the era of post-truth let us grow the habit of data-driven approach to any subject.