In this post, I will take you through a web scraping journey. I will scrape UN SDG database and produce csv file.
The URL that I want to scrape is as follows:
https://unstats.un.org/sdgs/indicators/database/?area=BGD
Which looks like.
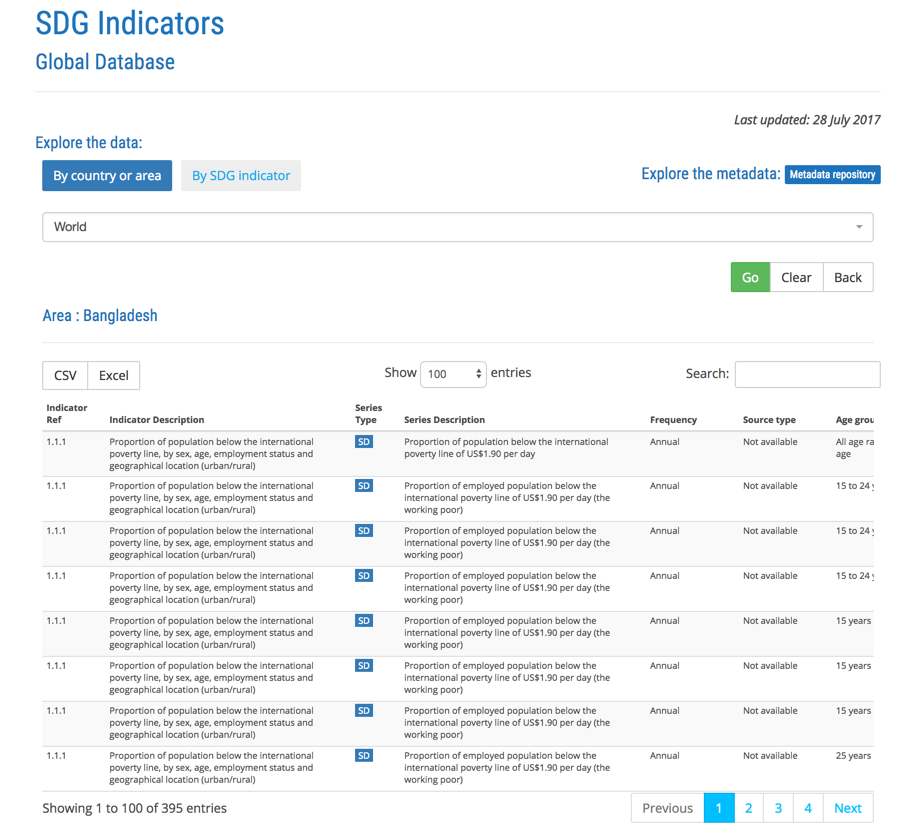
Each time you change the 3-letter ISO code of the country in the URL you get new table.
So, my logic goes as follows: iterate through a database of country codes and retrieve URL for each country and visit the UN site and download the data.
In what follows, I am first creating an empty master dataframe and an empty llist. I have country code list as csv file, so, I iterate through the country codes and call a function fetch_sdg_country which brings me the SDG data as dataframe. I will then pd.concat the new dataframe with existing master and start gradually growing my master data frame.
master = pd.DataFrame()
llist = []
for country in country_list:
    llist=[master,fetch_sdg_country(country)]
    master = pd.concat(llist)
    print('done with --> {}'.format(country))
Here is the fetch_sdg_country function.
def fetch_sdg_country(code):
    url ='https://unstats.un.org/sdgs/indicators/database/?area={}'.format(code)
    try:
        df = pd.read_html(url)[0]
        years = [str(y) for y in range(1990,2017)]
        selected_indicators = ['Goal',
       'Indicator Description', 'Series Type',
       'Country or Area Code','Country or Area Name',
       'Series Description',
       'Frequency', 'Source type', 'Age group', 'Location', 'Sex',
       'Value type', 'Unit', 'Unit multiplier'] + years
        df = df.loc[:,selected_indicators]
        return df
    except Exception as e:
        print(e)
Depending on your internet speed, you will start getting the country SDG data one by one. Whichever country does not exist, you will get the exception error printout.
Once the above loop ends, we have a big dataframe. But we are not done yet. Our years comes as columns. We want to unpivot our table and use the melt function of pandas.
sdgs_flat = pd.melt(sdgs, id_vars=['Goal', 'Indicator Description', 'Series Type', 'Country or Area Code',
       'Country or Area Name', 'Series Description', 'Frequency',
       'Source type', 'Age group', 'Location', 'Sex', 'Value type', 'Unit',
       'Unit multiplier'],var_name='Years', value_name='value')
Our new data looks like below.
<class 'pandas.core.frame.DataFrame'>
Int64Index: 415178 entries, 31 to 1782050
Data columns (total 16 columns):
Goal                     415178 non-null int64
Indicator Description    415178 non-null object
Series Type              415178 non-null object
Country or Area Code     415178 non-null object
Country or Area Name     415178 non-null object
Series Description       414966 non-null object
Frequency                415178 non-null object
Source type              415178 non-null object
Age group                415178 non-null object
Location                 415178 non-null object
Sex                      415178 non-null object
Value type               44548 non-null object
Unit                     415178 non-null object
Unit multiplier          415178 non-null object
Years                    415178 non-null object
value                    415178 non-null object
dtypes: int64(1), object(15)
memory usage: 53.8+ MB
Note that value column is of type object. This is because, UN guys sometimes kept certain data like <0.1 or >95.0. So, I want to remove all values of < or >. Here is how I do that.
for index, row in sdgs.iterrows():
    if row.value[0]=='>':
        sdgs.loc[index, 'value']= row.value.replace('>', '')
    if row.value[0]=='<':
        sdgs.loc[index, 'value']= row.value.replace('<', '')
Now, we can officially convert the type of this column and then save the result as csv file.
sdgs['value']= pd.to_numeric(sdgs['value'])
sdgs.to_csv('sdgs_flat.csv', index=False, encoding='utf-8')